How it works
Cut PJM capacity and transmission costs by acting on the right few hours
Every year, PJM sets your capacity and transmission charges from your demand in just a handful of peak hours. PJM Peak Tracker watches PJM's load forecasts and published load data, spots the days most likely to produce one of those hours, and tells you in time to do something about it. Here's what that looks like in the app.
Start each week with the Week Ahead outlook
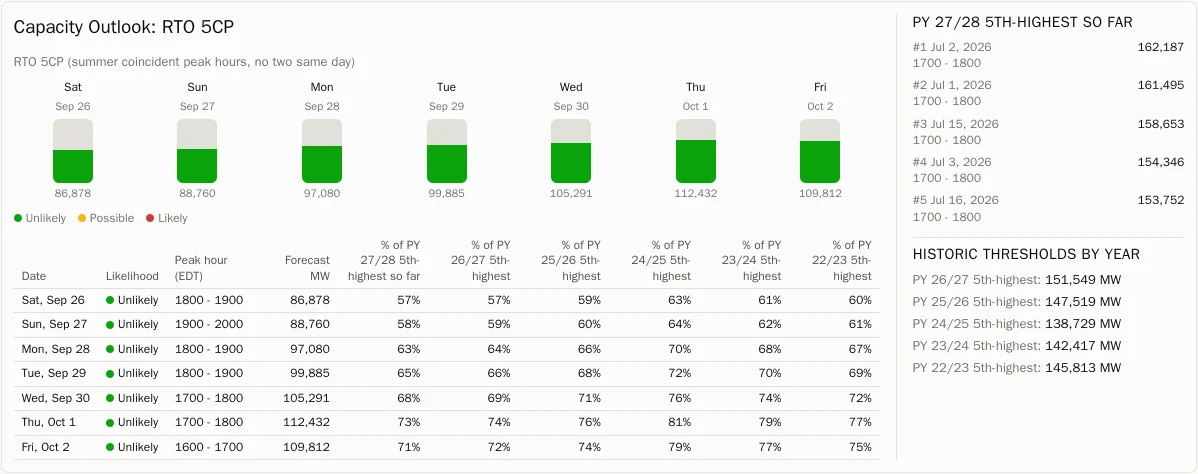
The Week Ahead page is your home screen. For today and the next six days it shows PJM's forecast peak load, the hour it's expected, and how that compares with this season's 5th-highest hour so far. That's the bar a new hour has to clear to count.
Each day gets a simple rating, Unlikely, Possible or Likely, so you can see at a glance whether this is a week to plan around.
Tip: Days rated Possible or Likely, especially during a heat wave, are the ones to put on your team's calendar.
See the hours that set your own bill
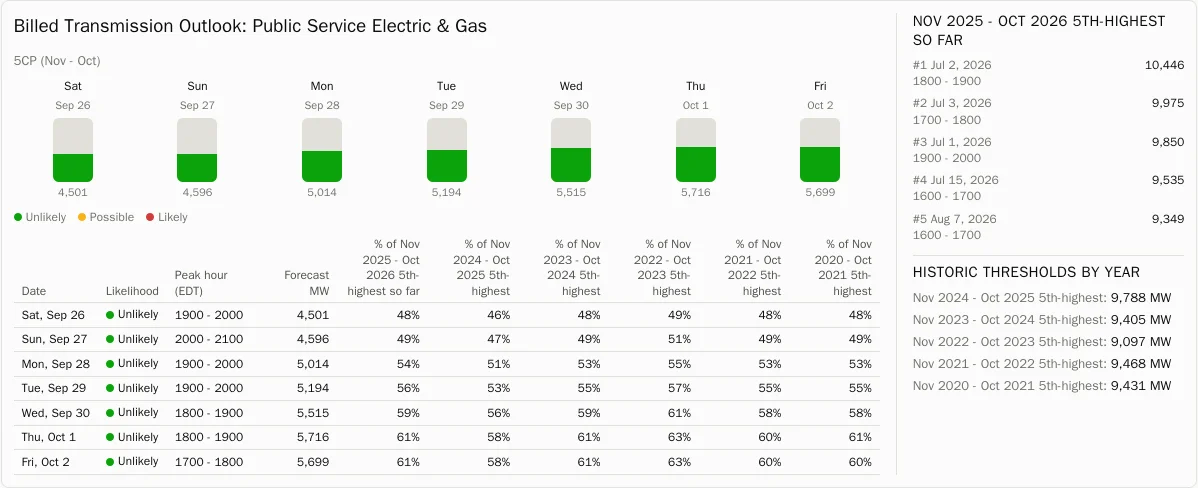
Transmission charges aren't based on the RTO peak. Your utility divides its zone's transmission peak (the Zone NSPL) among customers using the method in its tariff. That might be one peak hour or several, and some zones count winter months too.
Pick your zone once and set it as your default. The Billed Transmission Outlook then shows the week ahead measured against the peaks your utility will actually use.
Watch the forecast against actual load
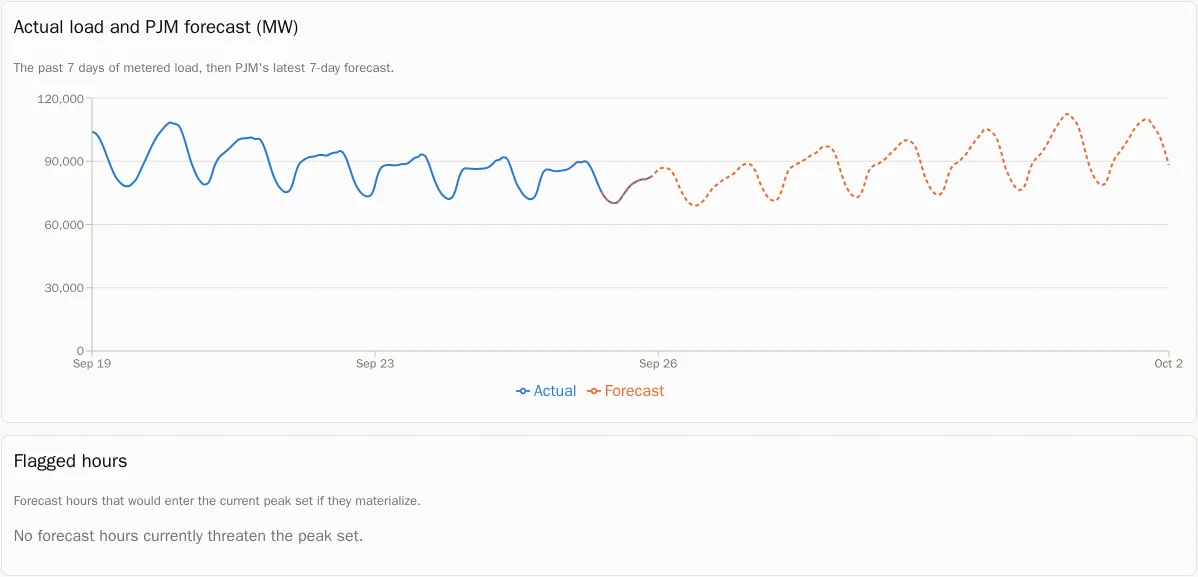
Forecast Watch plots the past week of actual load next to PJM's latest 7-day forecast, for the whole RTO or any zone. Below the chart, Flagged hours lists every forecast hour that would enter the current top set if it materializes, and which existing peak it would displace.
An empty flagged list, as in this late-September capture, means nothing in the coming week threatens the current peaks.
Turn on alerts and let them come to you
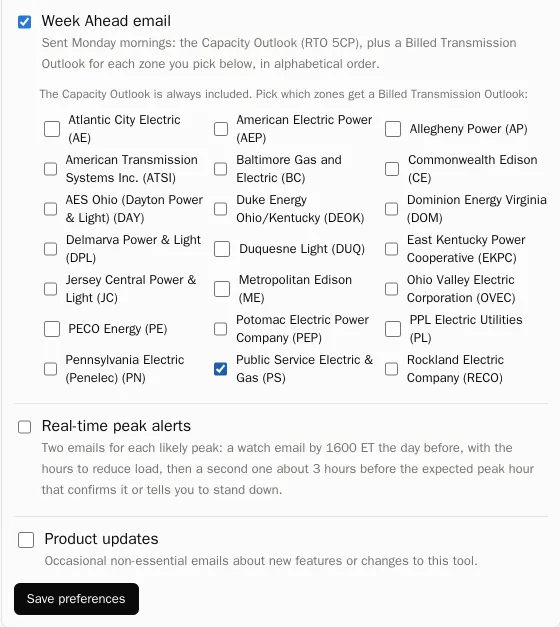
You don't have to check the site every day. Two opt-in subscriptions do the watching for you:
- Week Ahead email, Monday mornings: the Capacity Outlook plus a Billed Transmission Outlook for each zone you choose.
- Real-time peak alerts: a watch email by 1600 ET the day before a likely peak, with the hours to reduce load. About 3 hours before the expected peak hour, a second email confirms it or tells you to stand down, so a forecast that fades doesn't leave you curtailing for nothing.
Tip: Forward real-time peak alerts to whoever runs your curtailment plan, or set up a mail rule that pages them.
Track the season as it unfolds
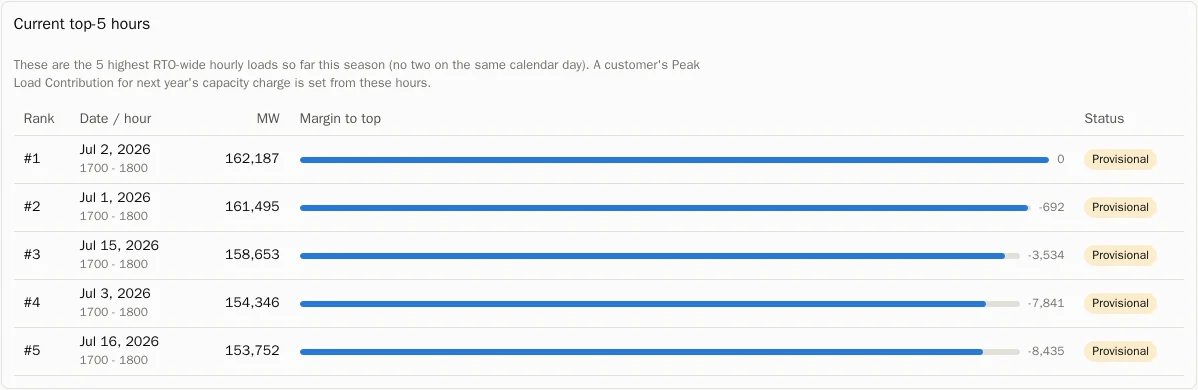
Peak History is the live scoreboard: how far through the season you are, the current top-5 hours, and the margin between them. A tight margin at #5 means a single hot afternoon can still change the result, so stay alert.
Hours are marked Provisional while the season is still open and a hotter day could replace them. They become Actual once the season window closes.
Check the results against PJM
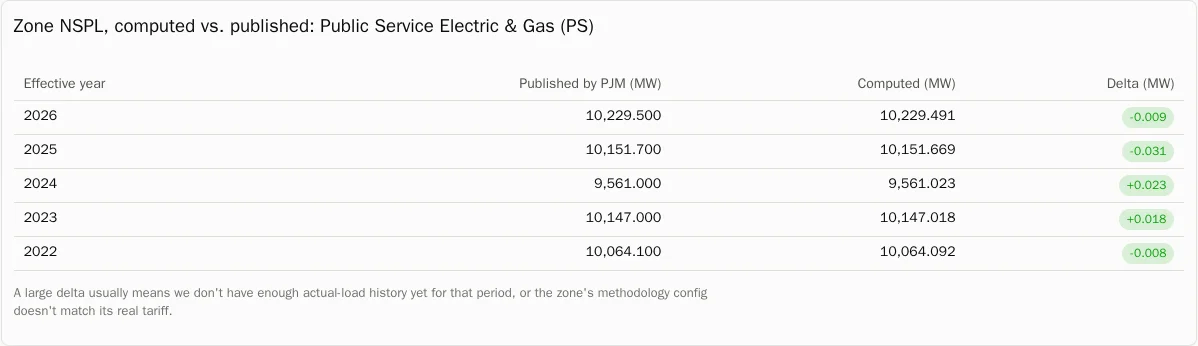
It also keeps every past season's peak hours, and compares the Zone NSPL we compute from raw load data with the value PJM publishes. Small deltas like these are how you know the method matches your utility's.
After each season, line these hours up against your own interval meter data to see how well your curtailments landed.
Practical ways to shave load during a peak hour
An alert is only worth something if you act on it. These are the approaches facilities most often use, and most need nothing more than a plan and a few hours' notice.
Pre-cool, then coast
Run HVAC harder in the morning and raise setpoints a few degrees through the alerted hour. The building's thermal mass carries you through.
Move flexible production
Shift batch processes, pumping, compressors, grinding or other interruptible loads to the morning or evening around the peak window.
Delay charging
Hold EV fleet and forklift charging, and ice or chilled-water storage, until after the peak hour passes.
Use on-site resources
Dispatch backup generation or battery storage only for alerted hours, rather than burning fuel on days that won't count.
Have a written playbook
Agree ahead of time what gets switched off, who does it, and how you confirm it. A 3-hour warning is plenty of time when the steps are already decided.
Don't over-curtail
Only the hours that end up in the peak set matter. Acting on every warm day wears people out. Focus on the days rated Likely.
How much you save depends on your supply contract and how your capacity and transmission costs are passed through to you. Check with your energy supplier or advisor about how a lower PLC or NSPL shows up on your bill.
Ready to try it?
Create an account, pick your zone and turn on alerts. It takes a couple of minutes.